Debugging ROS nodes started from launch file with Eclipse
Requirements
- Imported ROS project into Eclipse workspace (see http://wiki.ros.org/IDEs for details)
- Installed gdbserver (apt-get install gdbserver)
Follow the steps below.
1) Adjust the launch file:
Add this to the node tag if you want a new terminal window for the process
1 | launch-prefix="xterm -e gdbserver localhost:10000" |
or add the following if you want to stay in the current started terminal.
1 | launch-prefix="gdbserver localhost:10000" |
2) Eclipse Debug Configuration
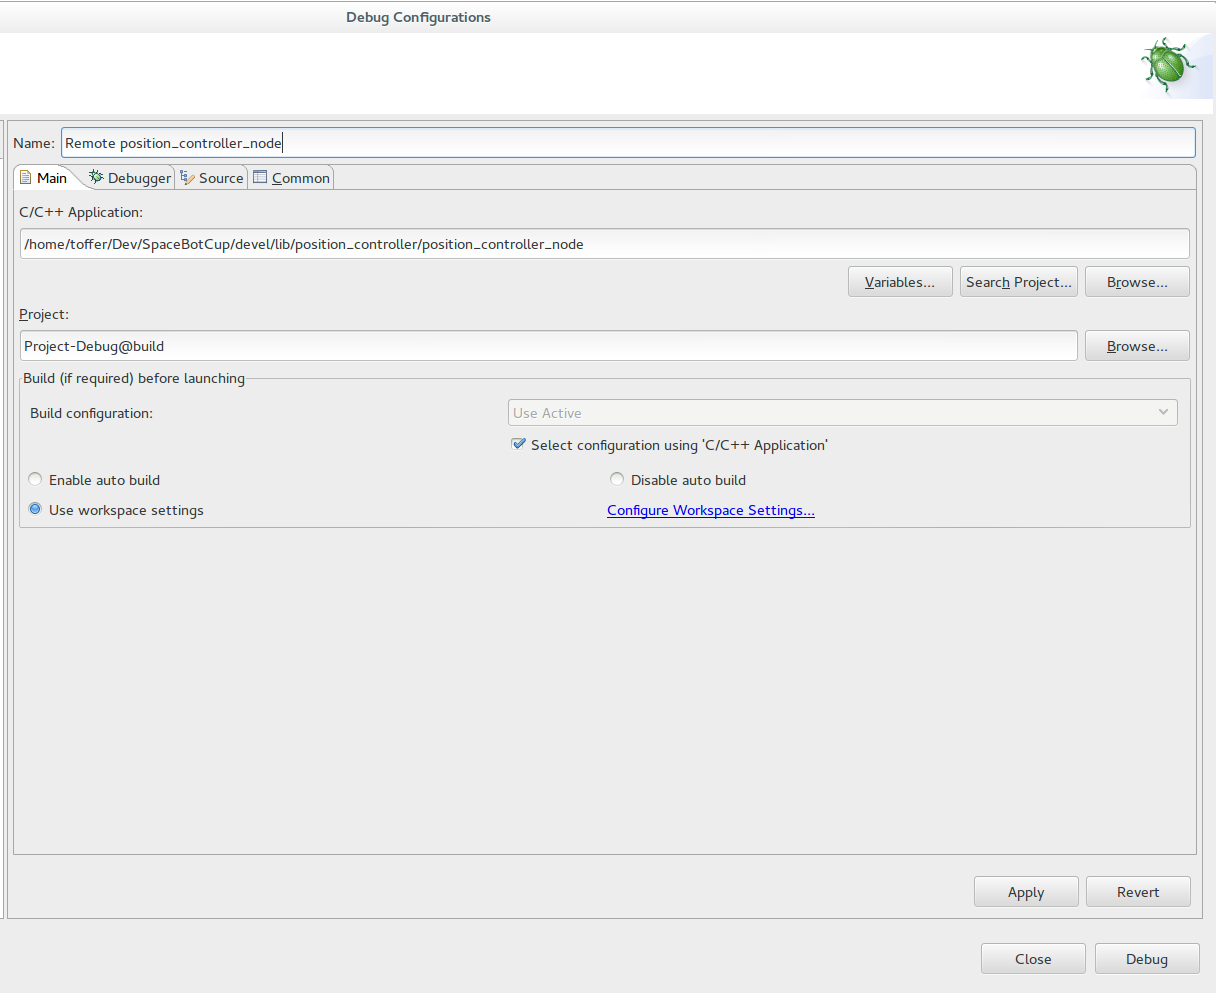
Add a new Eclipse debug run configuration for C/C++ Remote Application. Adjust the path to your C/C++ application binary, leave everything else default
3) Execution
First execute ROS launch with your launch file. You can either do this from the terminal or by a external tools hook from eclipse (http://answers.ros.org/question/10043/how-do-i-start-a-launch-file-from-eclipse-ide/)
Because I am using a multi-package ROS-Eclipse project and my launch files are always in the root of a package I am using ${container_name} instead of ${project_name} for the external tools arguments in Eclipse.
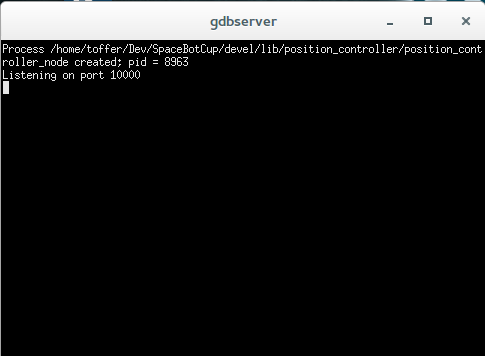
Now you will see that a small gdb terminal has opened if you are using the first version of launch file configuration from above.
Now, just start your Eclipse debug configuration and you are ready to debug.
Further References
- Setting up eclipse ide for ROS: http://wiki.ros.org/IDEs
- Several ROS launch “launch-prefix” command examples: http://wiki.ros.org/roslaunch/Tutorials/Roslaunch%20Nodes%20in%20Valgrind%20or%20GDB
- Launching gdb with ROS launch file: http://answers.ros.org/question/47210/how-to-roslaunch-node-in-gdb/


What do you think?
You must be logged in to post a comment.